Today we had our 8th flavored Dr Pepper Taste Test! 62 of our visitors put their tastbuds to work and told us what they thought of Amaretto, Cinnamon, Cranberry and Coconut Dr Pepper. Amaretto was bumped down to 3rd place this week and Cinnamon and Coconut took the lead.
Along with our Texas visitors, we also enjoyed talking to folks from New Jersey and both North and South Carolina!
Most of our taste testers today were under 20, but we had a fair repesentation of different age groups including 7 senior citizens.
Only one vote separated first and second place! Congrats to Cinnamon and better luck next time for Coconut. Amaretto came close behind in 3rd place and only 6 testers reported that they liked Cranberry the best.
Most of our visitors today didn't care for Cranberry, but suprisingly Coconut and Cinnimon, our winners, took 2nd and 3rd in the "Least Favorite" category.
Our testers were torn between Cinnamon and Coconut as the flavor they liked more than the original Dr Pepper. Never fear, 13 die hard Peppers told us that nothing beats original DP!
Most of our visitors think they would buy our concotions in the store. Which ones? Cinnamon, Coconut and Amaretto, of course!
Next week the winners from previous weeks will be battling each other head to head to decide the Dr Pepper Museum ULTIMATE FLAVOR CHAMPION! Drop by the second floor and join the fun!
Friday, July 31, 2009
Friday, July 24, 2009
7th Flavored Dr Pepper Taste Test
Today we had our 7th flavored Dr Pepper Taste Test. It was an exciting one with four new flavors. This week's flavors were Amaretto, Cinnamon, Cranberry and Coconut. We had close competition between the Amaretto and Cinnamon.
We had a total of 62 people who took the test.
Along with our Texas visitors, we also had visitors from Arkansas, Missouri, Iowa, California, Ohio, New York, Maryland, Tennessee and New Hampshire.
Age
27% were between the ages of 0-10.
11% were between the ages of 11-20.
18% were between the ages of 21-30.
13% were between the ages of 31-40.
10% were between the ages of 41-50.
6% were between the ages of 51-60.
6% were between the ages of 61-70.
2% were ages 71 and up.
6% did not report their age.
Which flavor did you like the most?
38.71% said they liked Amaretto Dr Pepper the most.
37.10% said they liked Cinnamon Dr Pepper the most.
16.13% said they liked Coconut Dr Pepper the most.
11.29% said they liked Cranberry Dr Pepper the most.
Which flavor did you like the least?
37.10% said they liked Coconut Dr Pepper the least.
33.87% said they liked Cranberry Dr Pepper the least.
14.52% said they liked Amaretto Dr Pepper the least.
14.52% said they liked Cinnamon Dr Pepper the least.
Which flavor did you like more than regular Dr Pepper?
25.81% said they liked Amaretto DP more than regular Dr Pepper.
19.35% said they liked Cinnamon DP more than regular Dr Pepper.
14.52% said they liked Coconut DP more than regular Dr Pepper.
11.29% said they liked Cranberry DP more than regular Dr Pepper.
33.87% said they liked regular Dr Pepper more than any of today's flavored versions.
Would you purchase any of the flavors if they were sold at your local grocery store?
56.45% said yes.
33.87% said maybe.
8.09% said no.
Which ones?
48.39% said they would buy Amaretto DP.
41.94% said they would buy Cinnamon DP.
27.42% said they would buy Coconut DP.
17.74% said they would buy Cranberry DP.
Please join us next Friday as we see these flavors battle again in the Summer 2009 Flavored Dr Pepper Taste Test. These tests are held on the 2nd floor at 11:30 in the classroom.
Tuesday, July 21, 2009
Come See The Wagons!
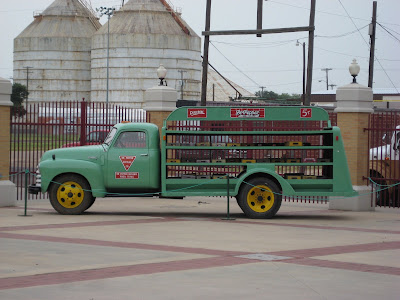
Due to construction that is about to begin in the Kellum-Rotan building (you know, the one with the big neon sign on the side!) the wagons and bulldog truck have been moved out to the courtyard for your viewing pleasure. You notice we said VIEWING pleasure, right? The vehicles currently have caution tape on them to discourage climbing on them. Feel free to use these great pieces of Dr Pepper history as an awesome photo op, but for your own safety please do not climb on them or up into them. It is for their safety, too! They are very old and don't do well with a lot of hands-on interaction. We are happy to be able to offer these as a temporary part of our courtyard exhibit before they are permanently placed in the new galleries of the Kellum-Rotan building as part of our Transportation Exhibit. We hope you enjoy them!


Friday, July 17, 2009
6th Flavored Dr Pepper Taste Test
Today we had our 6th flavored Dr Pepper Taste Test. We repeated last week's flavors of Peppermint, Coffee, Plum and Walnut. The results were interesting, though Peppermint DP still came in an overwhelming first.
We had 47 people who took the test.
Our out-of-state visitors were from Tennessee, Florida, Oklahoma, Louisiana and Ohio.
Age
19% were between the ages of 0-10.
23% were between the ages of 11-20.
11% were between the ages of 21-30.
26% were between the ages of 31-40.
2% were between the ages of 41-50.
11% were between the ages of 51-60.
4% were between the ages of 61-70.
4% did not report their age.
Which flavor did you like the most?
51.06% said they liked Peppermint Dr Pepper the most.
34.04% said they liked Plum Dr Pepper the most.
14.89% said they liked Walnut Dr Pepper the most.
6.38% said they liked Coffee Dr Pepper the most.
Which flavor did you like the least?
38.30% said they liked Coffee Dr Pepper the least.
29.79% said they liked Walnut Dr Pepper the least.
25.53% said they liked Plum Dr Pepper the least.
8.51% said they liked Peppermint Dr Pepper the least.
2.12% did not answer.
Which flavor did you like more than regular Dr Pepper?
29.79% said they liked Peppermint DP more than regular Dr Pepper.
19.15% said they liked Plum DP more than regular Dr Pepper.
2.12% said they liked Coffee DP more than regular Dr Pepper.
2.12% said they liked Walnut DP more than regular Dr Pepper.
46.81% said they liked regular Dr Pepper more than any of today's flavored versions.
Would you purchase any of the flavors if they were sold at your local grocery store?
51.06% said yes.
34.06% said maybe.
14.89% said no.
Which ones?
55.32% said they would buy Peppermint DP.
34.04% said they would buy Plum DP.
17.02% said they would buy Coffee DP.
17.02% said they would buy Walnut DP.
Return next week for 4 more exciting flavors. The Dr Pepper Museum does taste tests from 11:30-12:30 on the 2nd floor in the classroom. We hope to see you then!
Wednesday, July 15, 2009
Houston Mayor Visits the DPM!
On Tuesday, July 14th, Houston Mayor Bill White stopped by the Dr Pepper Museum! He visited with local supporters and Museum staff, and then enjoyed a Dr Pepper (of course!) from the soda fountain.
Mayor White took office in 2003 and was overwhelmingly re-elected in 2005 and 2007. He is now at the end of his mayoral career and is running for U. S. Senator. Here we see him with Interpretation Associate Katie Wolfe, Director of Interpretation Joy Summar-Smith, Mayor Bill White and Director of Communications Jennie Sheppard. He’s a Pepper!

Mayor White took office in 2003 and was overwhelmingly re-elected in 2005 and 2007. He is now at the end of his mayoral career and is running for U. S. Senator. Here we see him with Interpretation Associate Katie Wolfe, Director of Interpretation Joy Summar-Smith, Mayor Bill White and Director of Communications Jennie Sheppard. He’s a Pepper!

DPM Staffers Katie Wolfe, Joy Summar-Smith, and Jennie Sheppard with Mayor White
Friday, July 10, 2009
5th Flavored Dr Pepper Taste Test
Today we had our 5th flavored Dr Pepper taste test of the summer. This week we had the new flavors of coffee, peppermint, plum, and walnut! Take a look at the results below:
We had 39 people who took the test.
We had visitors from Texas, Florida, Georgia, and Maryland. We even had some international guests from Korea!
Age
13% were between the ages of 0-10
18% were between the ages of 11-20
15% were between the ages of 21-30
20% were between the ages of 31-40
8% were between the ages of 41-50
5% were between the ages of 51-60
5% were between the ages of 61-70
5% were age 71 and up
Which Flavor did you like Most?
30.77% said they liked Peppermint DP the most.
28.21% said they liked Plum DP the most.
28.21% said they liked Coffee DP the most.
10.26% liked Walnut DP the most.
Which flavor did you like the least?
41.03% said they liked Walnut DP the least.
30.77% said they liked Plum DP the least.
15.38% said they liked Peppermint DP the least.
10.26% said they liked Coffee DP the least.
Which flavor did you like more than regular Dr Pepper?
15.82% said they liked Peppermint DP more than regular DP.
12.82% said they liked Plum DP more than regular DP
5.13% said they liked Coffee DP more than regular DP.
2.56% said they liked Walnut DP more than regular DP.
61.54% said they did not like any of the flavored DP more than regular DP.
Would you purchase any of the flavors if they were sold at your local grocery store?
41.03% said maybe.
28.21% said yes.
12.82% said no.
12.82% didn't know
Which one(s)?
33.33% said they would buy Peppermint DP.
33.33% said they would buy Coffee DP.
23.08% said they would buy Plum DP.
17.95% said they would buy Walnut DP.
We'll do this again next Friday from 11:30 to 12:30. Come by for a visit to the Dr Pepper Museum and see what flavored Dr Pepper you would like.
Friday, July 03, 2009
4th Flavored Dr Pepper Taste Test Results!
Today we had our 4th flavored Dr Pepper taste test of the summer. This week we tested Caramel, Chocolate, Hazelnut and Vanilla flavored Dr Pepper again. Unlike last week, the visitors that participated did not have a clear favorite. However, the least favorite flavor rang loud and clear.

This week, 78 visitors put their taste buds to work testing our Dr Pepper concoctions!

In addition to our visitors from Texas, we were happy to welcome folks from Florida, New Jersey, New York, North Carolina, Arizona, Ohio, and Pennsylvania. We even had an international visitor from Tijuana, Mexico!
Age
14% were between the ages of 0-10.
18% were between the ages of 11-20.
17% were between the ages of 21-30.
13% were between the ages of 31-40.
23% were between the ages of 41-50.
5% were between the ages of 51-60.
3% were between the ages of 61-70.
5% were age 71 and up.
1% did not share their age.
Which Flavor did you like Most?
42% preferred Vanilla Dr Pepper.
39% preferred Caramel Dr Pepper.
5% preferred Hazelnut Dr Pepper.
5% preferred Chocolate Dr Pepper.
6% preferred not to answer.
Which flavor did you like the least?
65% liked Chocolate Dr Pepper the least.
14% liked Vanilla Dr Pepper the least.
12% liked Hazelnut Dr Pepper the least.
9% liked Caramel Dr Pepper the least.
Which flavor did you like more than original Dr Pepper?
15% liked Vanilla Dr Pepper more than the original.
13% liked Caramel Dr Pepper more than the original.
8% liked Chocolate Dr Pepper more than the original.
5% liked Hazelnut Dr Pepper more than the original.
59% thought that original Dr Pepper can't be beat!
Would you purchase any of the flavors if they were sold at your local grocery store?
47% said yes.
43% said maybe.
10% said no.
Which one(s)?
53% said they would buy Vanilla DP.
50% said they would buy Caramel DP.
12% said they would buy Chocolate DP.
9% said they would buy Hazelnut DP.
Next week we'll be introducing four new flavors for you to enjoy! Stop by the second floor of the museum between 11:30 and 12:30 on Friday, July 10th and tell us what you think.
Subscribe to:
Posts (Atom)
